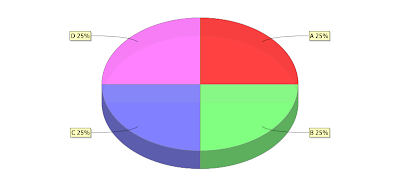
Lately, I have been working on a number of data visualization routines. When I first started here, I was working on a general framework to replace our existing chart generation software. I have some before and after pictures. Before and after pictures are usually interesting, either with houses, people's physique, or computer programs. These before and after pictures aren't the most stunning things in the world, but I thought my blog would be a good venue to share what I've been up to.
These are generated with Java code, using the JFreeChart graphing library. Currently, I am working on a project to apply some of these chart types to visualize our mail server's log, so our customers will be able to understand what is going on with our system in a visual way.


